Nonsuri is an education service that provides AI explanations for humanities essay problems. Instead of choosing AI models by benchmark scores alone, it began comparing real service outcomes using retake rates, payment rates, and problem-solving rates.
Using ABTO to compare its existing and new settings, Nonsuri saw model costs fall by 41% and the retake rate rise by 18%. In this Q&A, the team explains where it started and how it measured the change.
What made choosing an AI model difficult before?
Benchmarks alone made it difficult to choose a model that suited our service. Coding and math benchmarks had little to do with our users or Nonsuri’s explanations. They could tell us about a model’s general performance, but whether it worked well for Nonsuri users was a different question.
What mattered to us was whether users solved another problem after reading an explanation, went on to pay, or kept solving problems. Benchmark scores could not tell us any of that.
At first, we used a model known for strong performance. Our model costs kept rising each month, but we could not tell whether that spending led users to try another problem. We needed a way to compare outcomes and costs within our service.
What criteria did you decide to use?
We wanted to measure actual service outcomes through retake rates, payment rates, and problem-solving rates. That did not mean ignoring benchmarks. We wanted to look at the scores alongside what users did after experiencing the model.
For example, after receiving an explanation, did users solve another problem, become paying users, or continue working through problems? Looking at model call costs and user behavior separately could tell us what we spent, but not whether users of that model tried another problem. We needed to bring the two together and compare behavior across settings.
For this comparison, we focused on the retake rate. We wanted to see whether users came back to solve another problem after reading an explanation.
How did you compare the two settings with ABTO?
We connected Nonsuri’s AI explanation feature to ABTO. We tested different models by splitting users of the same feature: one group kept the existing settings, while the other received the new settings.
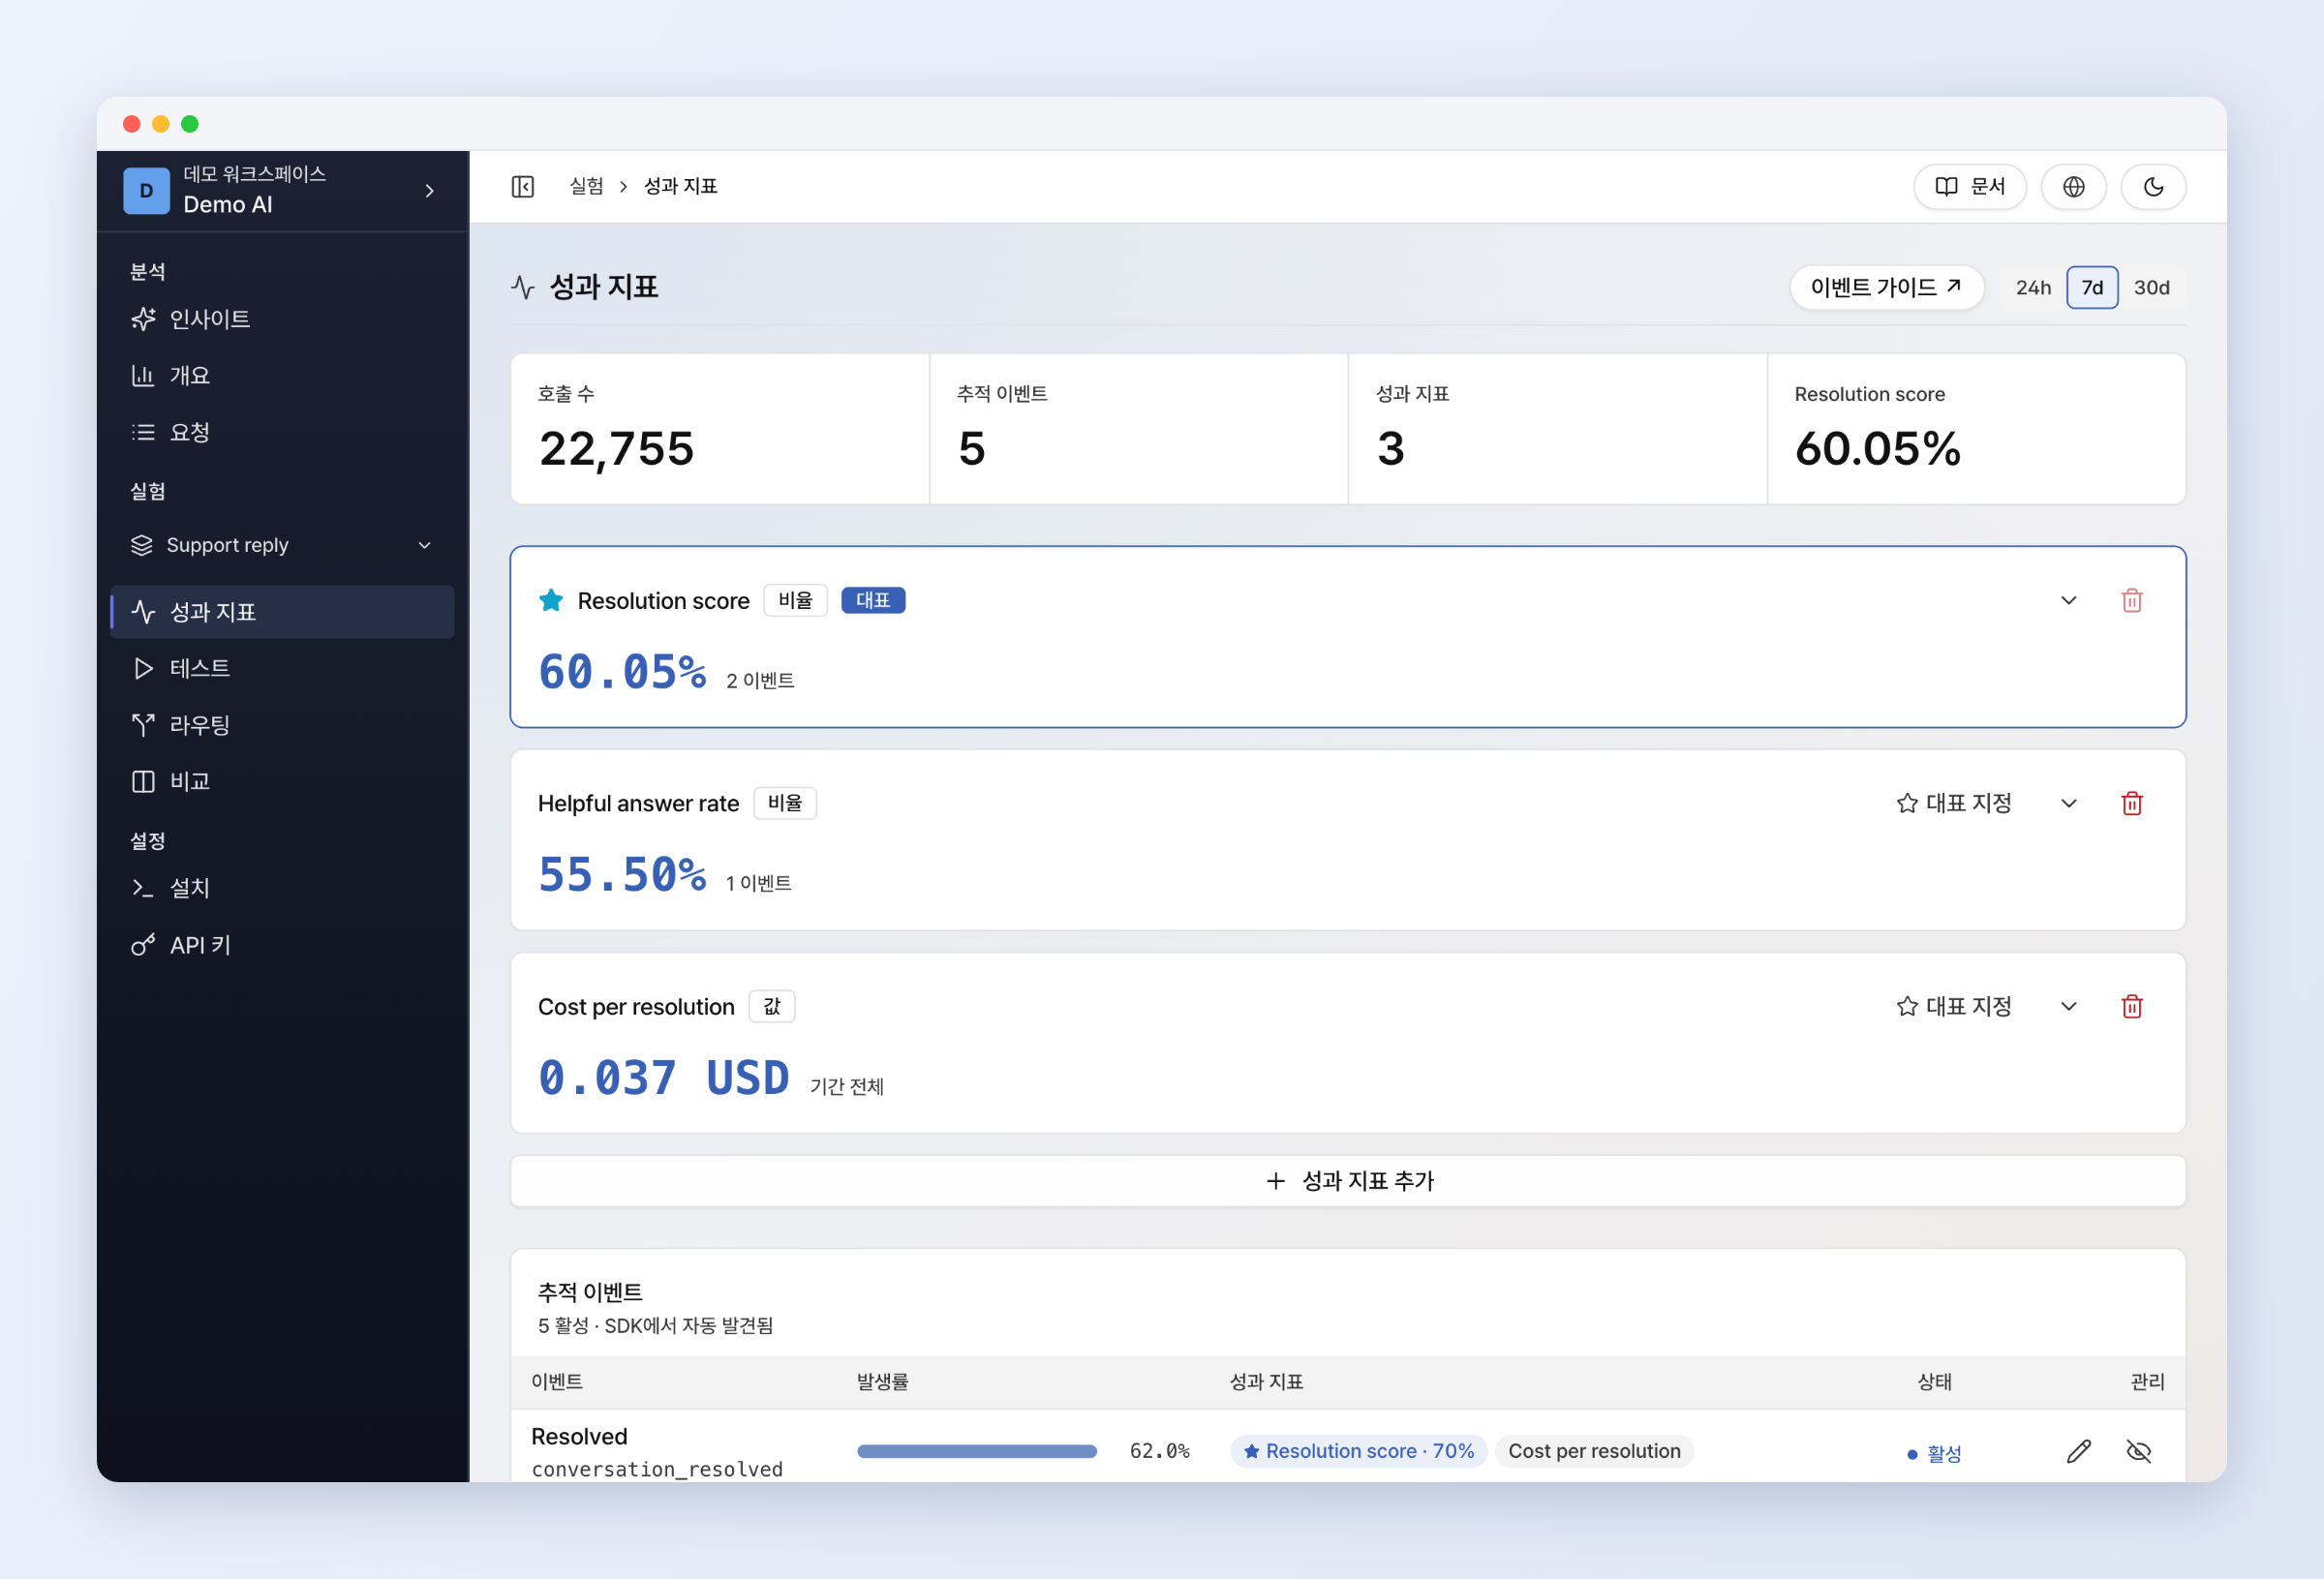
First, we set up Nonsuri’s success metrics in ABTO. The metrics we wanted to track included the payment action rate, grading scores, the rate of additional actions after solving a problem, and average cost per call. Then we split user traffic between the GPT luna model settings we wanted to try and our existing settings.
How did you roll out the new settings to real users?
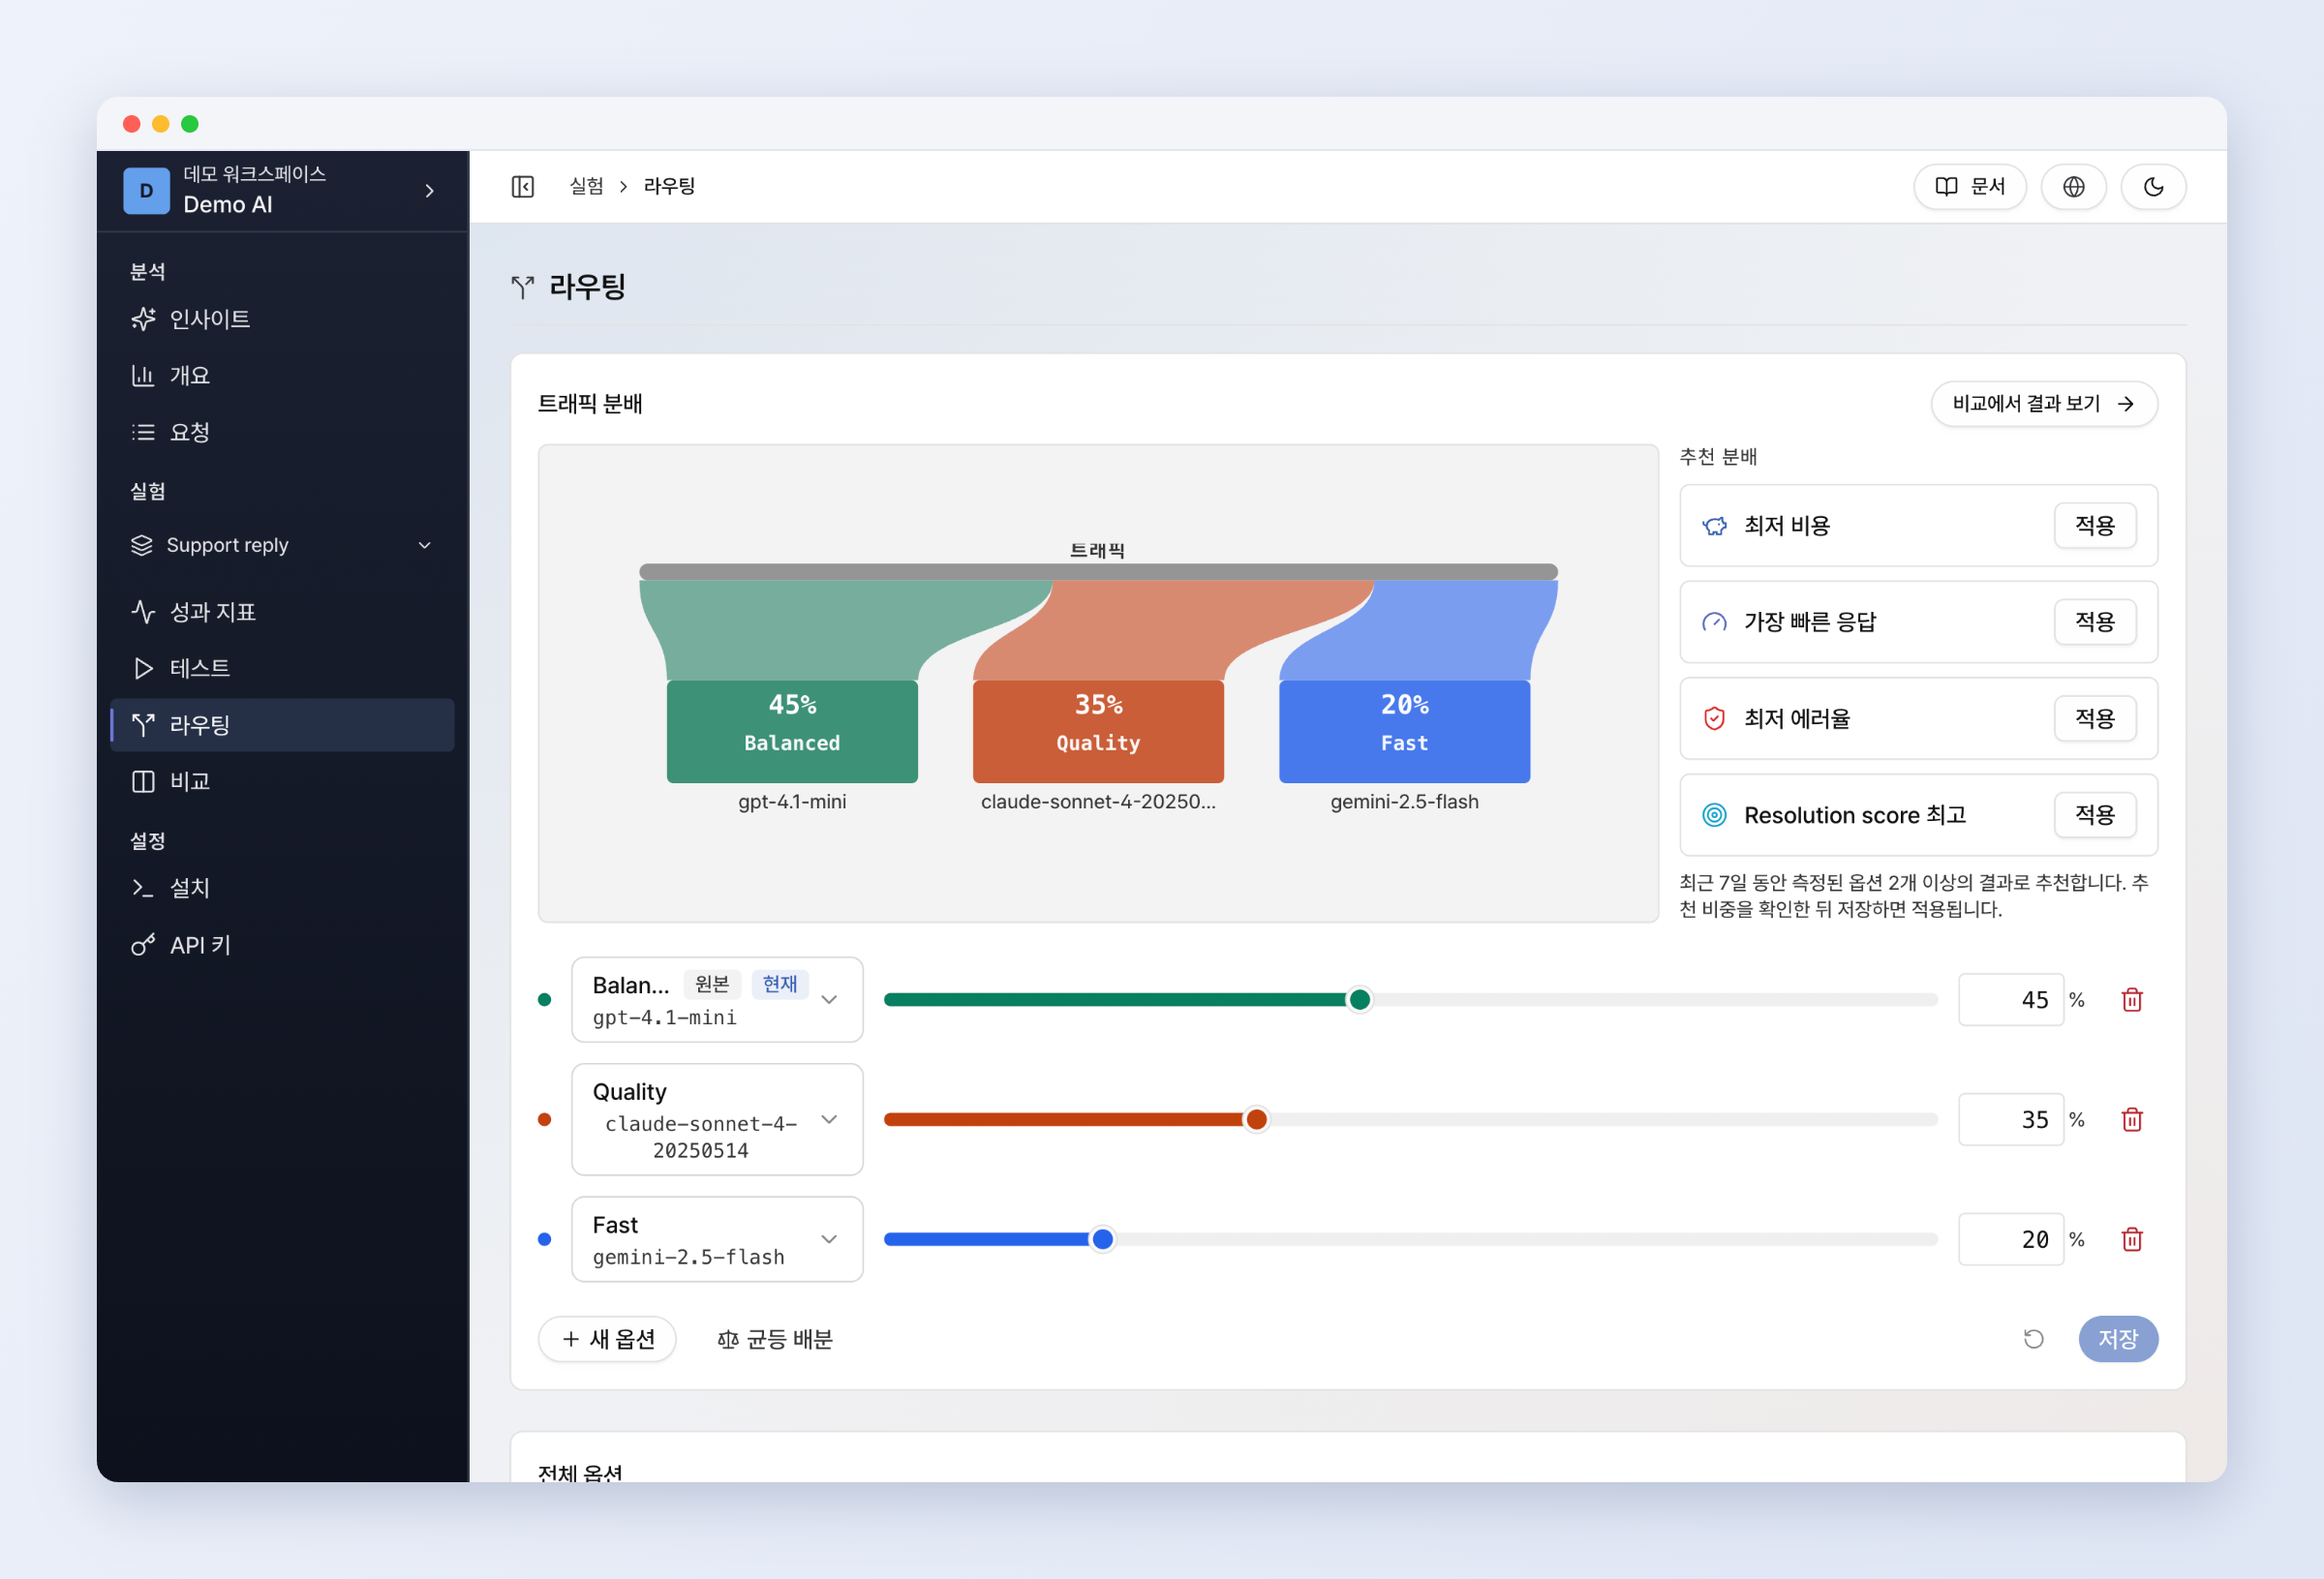
We did not apply them to everyone at once. We started with 10% of users and spent a few days checking error rates, response times, and changes in our success metrics.
After confirming there were no operational problems, we gradually increased the share to 50%. Being able to check that it worked for a small group before increasing the share step by step helped us prepare for potential problems.
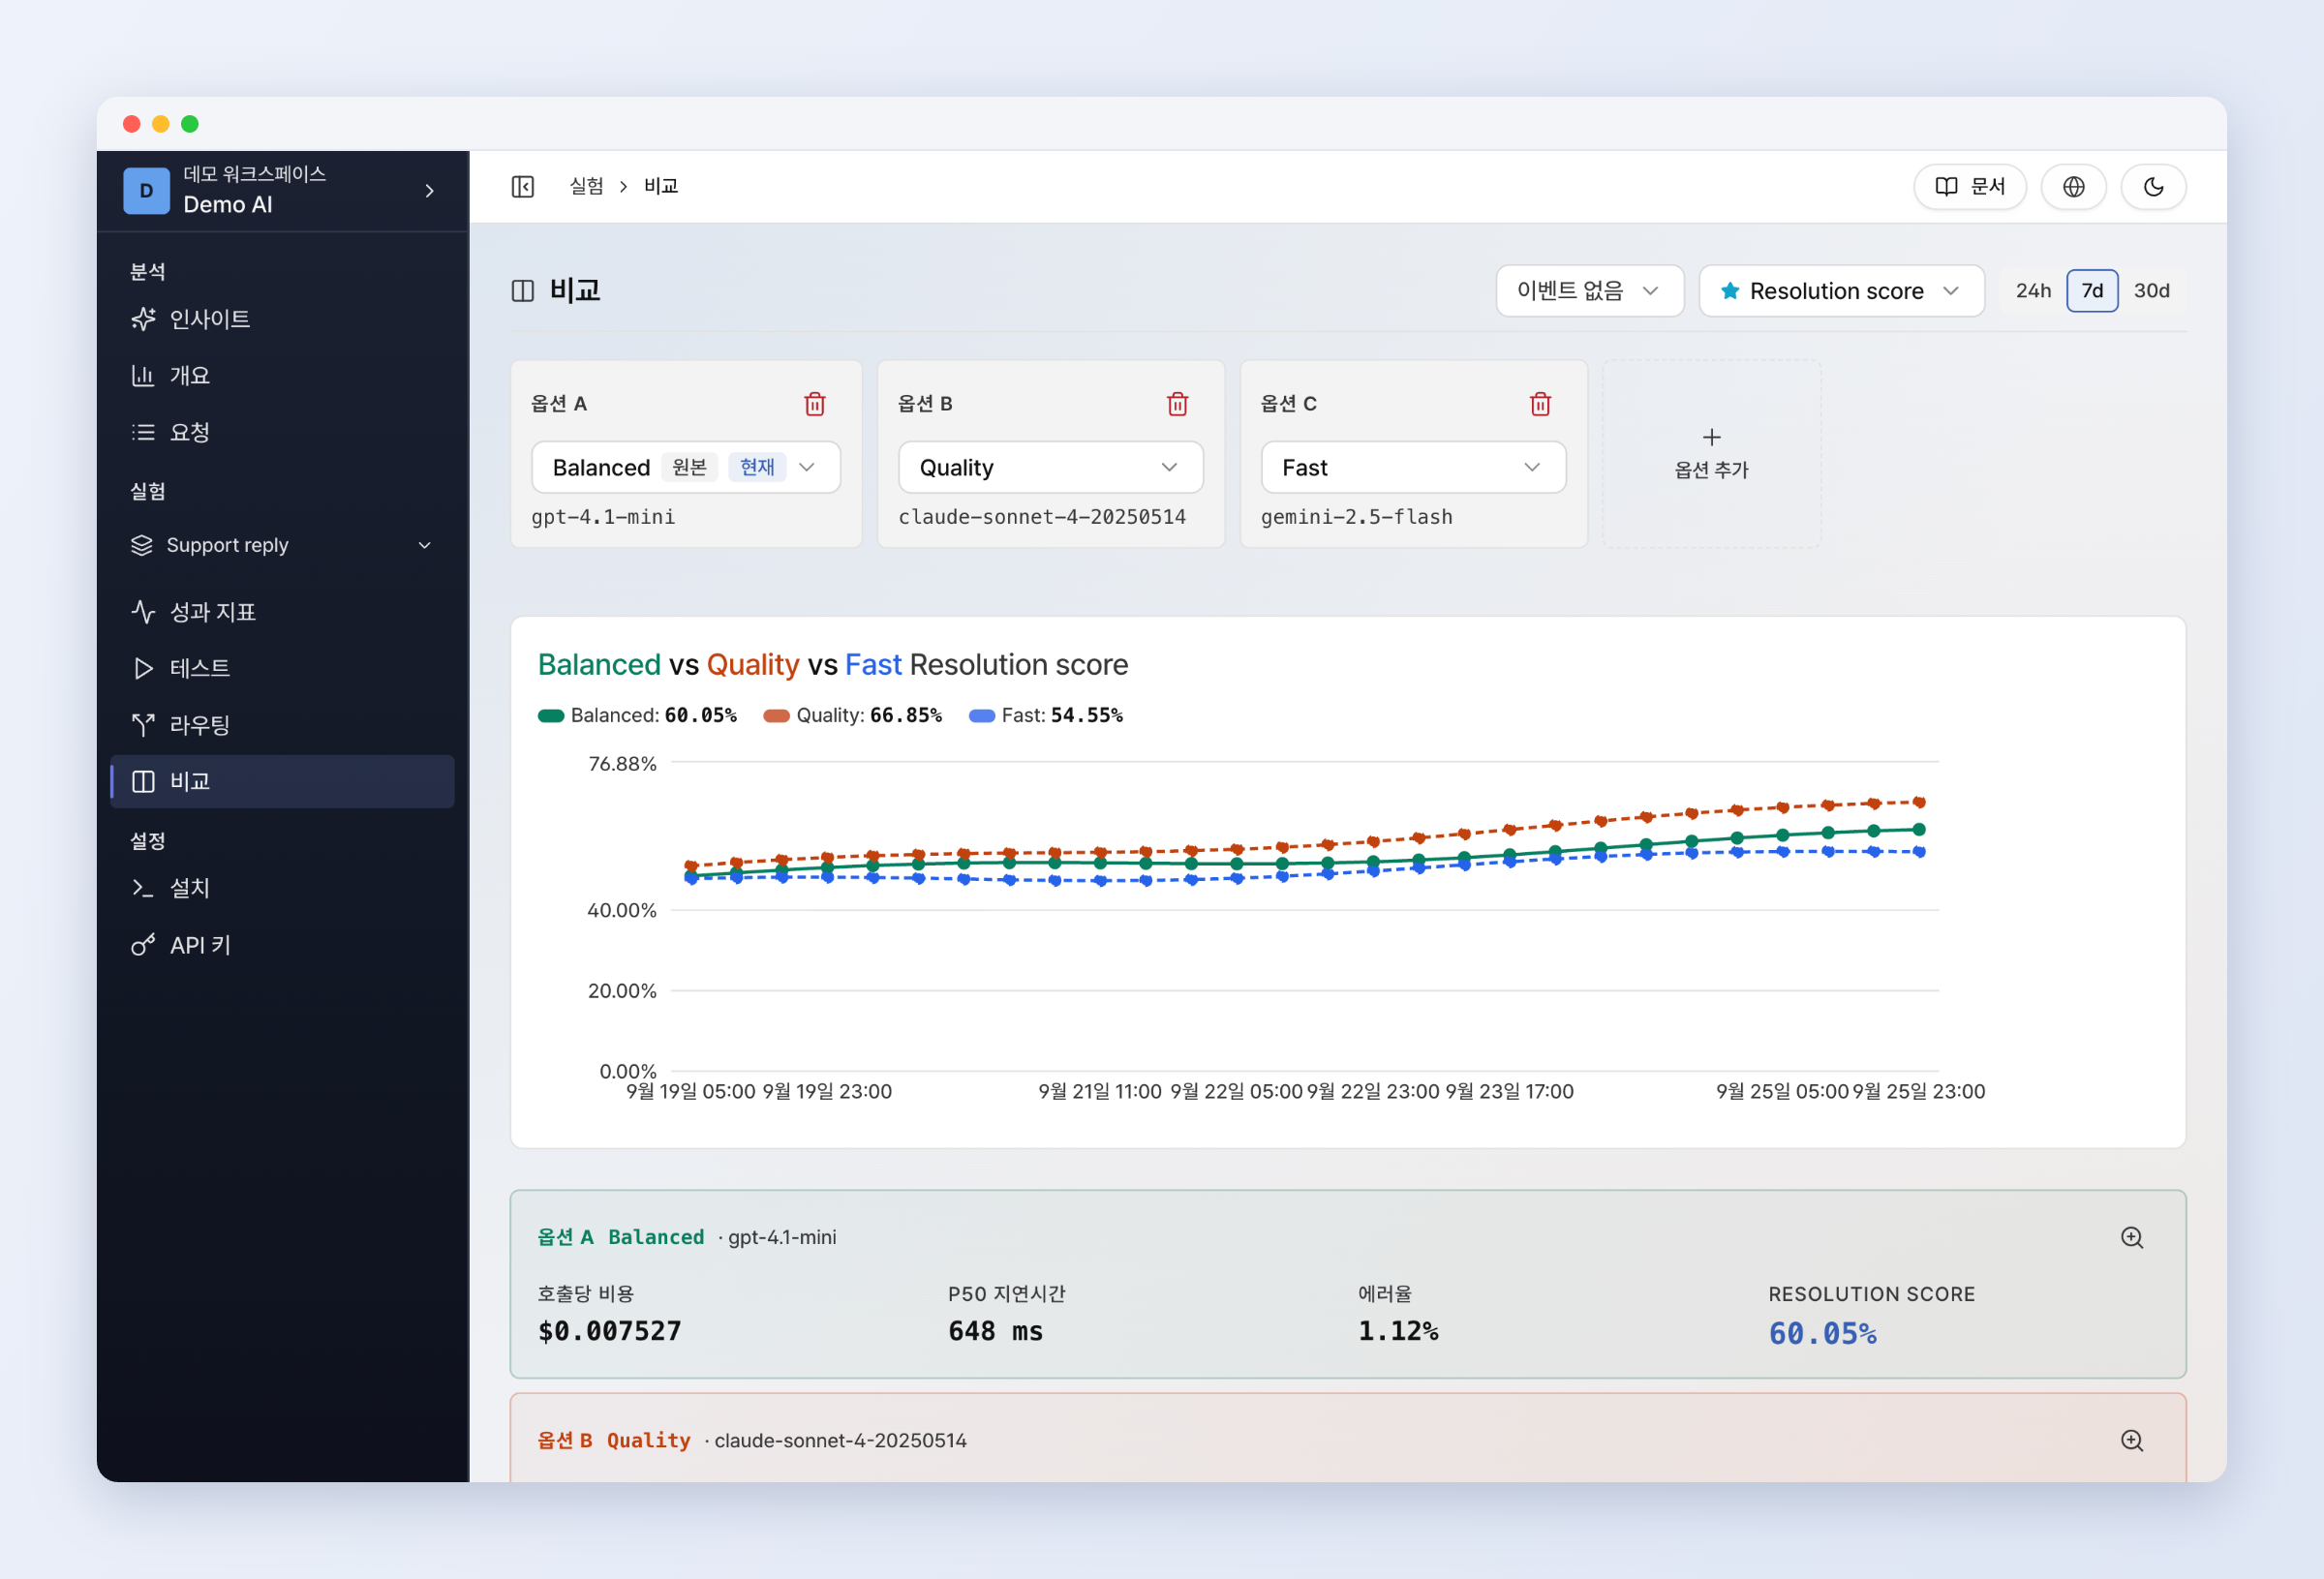
At first, the measurement period was short and the results kept changing. We continued comparing while we waited for more data to accumulate.
What changed as a result?
After tracking the results for more than a week, we found that the new settings reduced model costs by 41% and increased the retake rate by 18%. More users also finished reading the explanation of an essay problem and moved on to the next problem.
We used success metrics to choose the model our customers preferred. It turned out not to be the expensive one, so we could lower the AI model’s unit cost. The change we observed was not just lower costs—the retake rate improved too.
How has this changed the way you choose models?
We now use our users’ behavior alongside benchmark scores and a model’s reputation. We look beyond whether a model is known to be good: do its users solve another problem, and how much does it cost to achieve that outcome?
We evaluate models using metrics that fit our service, such as retake rates, payment rates, and problem-solving rates. This time, we were able to compare the retake rate and costs directly. Expensive models and long answers were not always the best choice. That does not mean cheaper models are always better. What we liked was being able to use ABTO to test and change our AI model settings based on how our users actually responded.
With ABTO, Nonsuri defined behavior metrics that fit its service, introduced new settings to a portion of users, and compared costs with outcomes once enough data had accumulated. If you are deciding which AI model to use, start by defining the user behavior you want to measure, then check it in ABTO.
ABTO is an AI model A/B testing tool that compares costs and user responses in one place.
Install the ABTO Skill in your agent and ask /abto Integrate ABTO to connect it in under five minutes.
Learn how to compare AI costs with outcomes